Deciphering your GMAT score report can feel like unraveling a complex puzzle. You’ve put in the effort, taken the tests, and now it’s time to understand what those numbers and percentages truly mean. Whether you’re aiming for a top-tier MBA program or making informed decisions about your next steps, understanding your GMAT score report is crucial.
So, how can you efficiently interpret this critical document without feeling overwhelmed? Let’s break it down together!
“Your GMAT score report is more than just a number. It’s a comprehensive summary of your strengths and areas for improvement.”
In this article, we’ll guide you through each section of your GMAT score report, help you make sense of the data, and explain how to leverage these insights for your MBA applications. Let’s dive in!
Decoding the GMAT Score Report: A Step-by-Step Guide
The GMAT Score Report can seem daunting at first glance, but breaking it down step by step makes it easier to understand. Here’s how you can decode your report effectively:
1. Understand the Overall GMAT Score: Your total GMAT score ranges from 200 to 800 and is derived from your performance in the Verbal and Quantitative sections. It’s the primary number that MBA programs will look at, so it’s crucial to grasp its significance.
2. Analyze Section Scores: Each of the GMAT sections—Verbal, Quantitative, and the newly added Data Insights—has its own scaled score. These scores typically range from 6 to 51 and provide deeper insight into your strengths and weaknesses.
3. Percentile Rankings: Next, check out your percentile rankings next to each score. Percentiles show how your performance compares to other test-takers. For example, a ranking in the 80th percentile means you scored higher than 80% of those who took the GMAT.
4. Detailed Performance Insights: Dive into the granular details of your performance. The GMAT Focus Edition Official Score Report provides insights by section, question type, content domain, and even time management—each of which can help you identify specific areas for improvement.
5. Compare with Averages: Utilize the GMAT Score Chart to see how your scores stack up against the average scoresfor your target MBA programs. This step is crucial in understanding where you stand and what targets you need to hit.
6. Use a GMAT Score Calculator: This tool is invaluable for playing with different scaled scores to estimate your total GMAT score. Input your Verbal, Quant, and Data Insights scores to see how various combinations affect your overall result.
Remember, achieving a high GMAT score requires significant preparation and practice. Setting a target score, taking a diagnostic test, and focusing on weaknesses can dramatically improve your performance.
With these steps, decoding your GMAT Score Report becomes a structured and manageable process, enabling you to make informed decisions about your MBA journey.
Breaking Down Each Section of Your GMAT Score Report
The GMAT Focus Edition has some updated components compared to the traditional GMAT. Here’s a detailed breakdown of each section in the GMAT Focus Edition:
1. Total Score
- Range: 205-805
- Components: The total score combines the performance from the three main sections: Quantitative Reasoning, Verbal Reasoning, and Data Insights.
- Percentile Ranking: Indicates how your score compares to other test-takers.
2. Quantitative Reasoning
- Score Range: 60-90
- Skills Tested: Focuses on problem-solving and data sufficiency. You will need to demonstrate the ability to interpret and analyze quantitative information.
- Percentile Ranking: Shows how your performance compares to other test-takers in this section.
3. Verbal Reasoning
- Score Range: 60-90
- Skills Tested: Assesses reading comprehension, critical reasoning, and sentence correction. This section evaluates your ability to understand and evaluate written material and to correct written material to conform to standard written English.
- Percentile Ranking: Provides context on how you performed relative to others.
4. Data Insights
- Score Range: 60-90
- Skills Tested: Combines elements of Integrated Reasoning and traditional Quantitative and Verbal questions. It evaluates your ability to analyze data presented in different formats, such as tables, graphs, and multi-source reasoning.
- Percentile Ranking: Offers a comparison with the performance of other test-takers.
Key Differences in the GMAT Focus Edition:
- Fewer Questions: The GMAT Focus Edition has fewer questions and a shorter testing time compared to the traditional GMAT.
- Emphasis on Data Insights: There is a new Data Insights section that combines skills from both Quantitative and Verbal sections, reflecting the increasing importance of data analysis skills in business.
Understanding Percentile Rankings:
Percentile rankings provide insight into how your scores compare to those of other test-takers. For example, a 75th percentile ranking means you scored better than 75% of test-takers.
Preparing for the GMAT Focus Edition:
- Quantitative Reasoning: Practice problem-solving and data sufficiency questions.
- Verbal Reasoning: Focus on reading comprehension, critical reasoning, and sentence correction.
- Data Insights: Develop skills in analyzing data from various sources and formats.
This breakdown should help you better understand and interpret your GMAT Focus Edition score report, allowing you to target areas for improvement effectively.
What is a Good GMAT Score? Benchmarks and Percentiles
Determining what constitutes a “good” GMAT score for the GMAT Focus Edition depends on your target business schools and career goals. Here’s a comprehensive guide to understanding good GMAT scores, benchmarks, and percentiles:
Understanding Benchmarks and Percentiles
Total Score Benchmarks
- Excellent Score: 750-805 (90th percentile and above)
- Typically competitive for top-tier business schools like Harvard, Stanford, and Wharton.
- Competitive Score: 700-750 (80th-89th percentile)
- Competitive for many top 20 business schools, including those in the M7 group.
- Good Score: 650-700 (70th-79th percentile)
- Adequate for many well-regarded business schools, potentially requiring stronger application components.
- Average Score: 600-650 (50th-69th percentile)
- May be sufficient for less competitive programs but could require strong supplementary application materials.
- Below Average Score: Below 600 (below 50th percentile)
- May limit options to less competitive programs and often necessitates retaking the GMAT.
Section Scores Benchmarks
Quantitative Reasoning (60-90)
- Excellent: 85-90 (85th percentile and above)
- Competitive: 75-84 (70th-84th percentile)
- Good: 65-74 (50th-69th percentile)
- Below Average: Below 65 (below 50th percentile)
Verbal Reasoning (60-90)
- Excellent: 85-90 (85th percentile and above)
- Competitive: 75-84 (70th-84th percentile)
- Good: 65-74 (50th-69th percentile)
- Below Average: Below 65 (below 50th percentile)
Data Insights (60-90)
- Excellent: 85-90 (85th percentile and above)
- Competitive: 75-84 (70th-84th percentile)
- Good: 65-74 (50th-69th percentile)
- Below Average: Below 65 (below 50th percentile)
Analytical Writing Assessment (0-6)
- Excellent: 5.5-6 (90th percentile and above)
- Competitive: 5.0-5.4 (75th-89th percentile)
- Good: 4.0-4.9 (50th-74th percentile)
- Below Average: Below 4.0 (below 50th percentile)
How Percentiles Work
Percentiles show how your score compares to those of other test-takers. For example, if you are in the 80th percentile for Quantitative Reasoning, you scored higher than 80% of test-takers.
Example Interpretation
- Total Score: 720 (85th percentile)
- Indicates a strong overall performance.
- Quantitative Reasoning: 78 (80th percentile)
- Reflects strong quantitative skills.
- Verbal Reasoning: 75 (75th percentile)
- Indicates good verbal abilities.
- Data Insights: 76 (78th percentile)
- Demonstrates proficiency in data analysis.
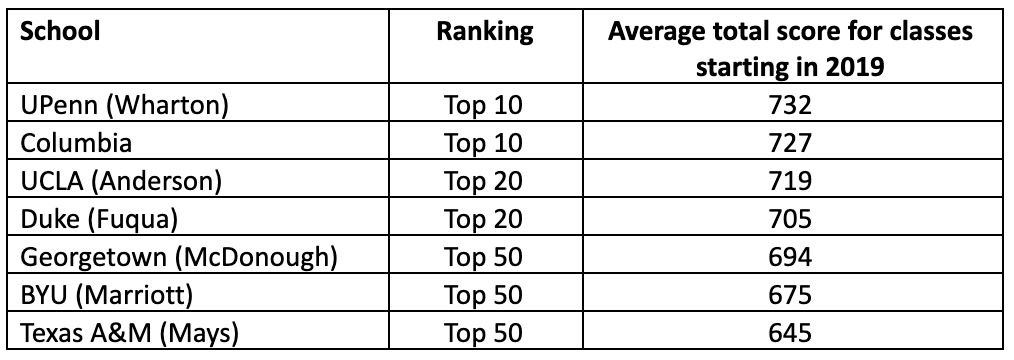
Target Scores for Top Business Schools
- Harvard Business School: Typically 730+
- Stanford GSB: Typically 740+
- Wharton: Typically 730+
- INSEAD: Typically 710+
- London Business School: Typically 700+
Factors Affecting What Is a Good Score
- Target Schools: Higher scores are necessary for more competitive programs.
- Application Strength: Strong work experience, leadership, and recommendation letters can balance lower GMAT scores.
- Career Goals: Some industries (e.g., consulting, investment banking) may favor higher GMAT scores.
Conclusion
A “good” GMAT score is relative and depends on your individual goals and target schools. Understanding your percentile ranking helps contextualize your performance among other test-takers. Generally, aiming for at least the 75th percentile (around 700+) provides a competitive edge for many top business schools.
Common Misconceptions About GMAT Scores
When it comes to GMAT scores, several misconceptions can cloud your understanding and expectations. Let’s clear some of these up:
Myth 1: A Perfect Score Guarantees Admission
It’s easy to assume that a perfect GMAT score will automatically open the doors to any top-tier MBA program. However, admissions committees consider a range of factors, including professional experience, letters of recommendation, and essays. Your score alone won’t secure a spot—it’s your whole application package that counts.
Myth 2: The GMAT is the Most Important Part of Your Application
While a strong GMAT score is essential, it’s not the be-all and end-all. Admissions officers look for well-rounded candidates who demonstrate leadership skills, a unique perspective, and the ability to contribute to the campus community.
Myth 3: You Can’t Improve Your GMAT Score Significantly
Many believe that once they achieve a certain score, their capabilities are set in stone. In reality, with focused preparation and practice, you can substantially improve your GMAT performance. Many students take the test multiple times to achieve their desired scores.
Myth 4: Only Quantitative Skills Matter
Some candidates focus solely on brushing up their quantitative skills, thinking that this is all the GMAT measures. Remember, the test assesses both quantitative and verbal abilities, and each section contributes significantly to your overall score.
Myth 5: Percentile Rankings Stay the Same
Finally, there’s the misconception that percentile rankings are static. In fact, percentile rankings fluctuate as they are based on the scores of everyone who has taken the test within a rolling period, usually the last three years.
Understanding and debunking these myths will help you approach your GMAT preparation and MBA applications with a clear, informed perspective, ensuring that you put your best foot forward in every aspect of the process.
Beyond the Numbers: Understanding the Skills Your GMAT Score Reflects
- Quantitative Reasoning: Reflects your ability to analyze data and draw conclusions using reasoning skills. It indicates your preparedness for the data-heavy coursework in business school.
- Verbal Reasoning: Measures your ability to read and comprehend written material, evaluate arguments, and correct written material to conform to standard written English. This showcases your potential to manage and interpret complex information.
- Data Insights: Evaluates your ability to interpret graphic data, find patterns and trends, and make data-driven decisions, which are critical skills in today’s business environment.
- Time Management Skills: Your performance across sections also reflects your ability to manage time effectively under pressure, a vital skill in both academic and professional settings.
Mastering time management is crucial for acing the GMAT. Each section of the exam has its own time constraints, and managing these efficiently can make a significant difference in your overall score. The GMAT score report includes the Time Management & Performance section, which shows your response time for each question. Understanding how you allocate time across questions can provide key insights into your performance.
Identify Time Drains: Look for questions where you spent considerably more time. These might be areas where you second-guessed yourself or lacked confidence. Pinpointing these time drains allows you to strategize better for your next attempt.
Practice Timing Strategies: During your preparation, simulate real test conditions by timing each section. Use tools like a stopwatch or test simulation software to build a sense of pacing. Experts recommend practicing with challenging questions to build your speed without sacrificing accuracy.
Balance Speed and Accuracy: It’s important to strike a balance between speed and accuracy. While you need to move quickly, ensuring you answer questions correctly is just as vital. Quick, educated guesses might save time but rely on solid reasoning skills honed through practice.
Remember, taking the time to review the Time Management & Performance section of your score report is not just about looking at numbers. It’s about understanding your approach to the test and finding opportunities to refine your strategy, thereby boosting your confidence and performance on test day.